Posts

Showing posts from 2016

Featured Post

Clearly, Not Everyone Is Getting Rich Off The Stock Market

Image
Well, the NY Fed was out today with its Quarterly Report on Household Debt and Credit for Q4 2017. Clearly, Americans are in a lot of debt. Take a look. Just a couple of quick hits from the report. Total U.S. household debt rose $193 billion in the 4th quarter, to a new all-time peak of $13.15 trillion. That's 17.9% above the most recent trough in Q2 2013. Broken down by segment, what do you suppose was the largest gain in percentage terms? Credit cards, with a 3.2% increase. In the picture above, the widening gap represented by the red arrows reflects the fact that non-housing debt is rising at a faster pace than housing debt. Here's what's troubling about that. Below is a picture of the stock market, as represented by the S&P 500 index, over that same period; from the most recent credit trough in Q2 2013 to the end of 2017. And thus, the title of this article. Over that period, the S&P 500 index rose by 75%; from roughly 1,600 to 2,800. Apparently, ho

Making Investing Simple

Image
Sometimes, investing can be scary and intimidating. A recent article suggested this as one key reason that some 80% of millennials have not invested in the stock market . In my work as ETF Monkey, one of my goals is to take fear out of the equation, and suggest that anyone who has even a little money to invest can be successful. Let me give you an example of how I believe what, at first, can seem intimidating and scary can be made simple and understandable. Recently, I read a wonderful article on Seeking Alpha, for whom I am also a contributor. In the article, the author performs a review of 2016 and, in the process, nicely explains some realities about investing. Someone new to investing, however, might find the article a little technical and hard to understand. So, let me attempt to simplify it and also explain how it relates to, for example, the three implementations of The ETF Monkey 2016 Model Portfolio. The author explains that, when you invest, you expect to take a dollar

A Cautionary Note On Debt

Personal finance site NerdWallet recently released the results of their study on 2016 American Household Credit Card Debt . Among other figures, they note that average household credit card debt is up to roughly $16,000, and that it is costing households who carry this debt roughly $1,300 per year in interest. The article is worth a look. For millennials, it is an opportunity to learn from others and to be proactive with respect to your own circumstances. Yes, it may mean saying "no" to yourself once in a while, and getting the Grande instead of the Venti. But, in the long run, you'll be way ahead of the game.

Some Life & Investment Advice To A Millennial

I recently wrote an article for Seeking Alpha suggesting a specific ETF-based portfolio for millennials to consider as their New Year's resolution going into 2017. In the comments section, I received the following question from a 25-year old reader. If this has already been answered, I apologize, but why would someone invest in this portfolio rather than increase their IRA contributions or save up to contribute to their Roth? The reason I am asking is that I have been thinking about investing outside of my IRA, but to me, it does not make sense to use that extra money in a taxable account, where I could use it in a nontaxable instead . . . I ended up writing a fairly long response to this young man. As I reviewed it afterward, it occurred to me that this might form a nice article in and of itself. So, here it is:

Millennials - Make 2017 The Year To Invest In Your Future

Millennials, hasn't 2016 just seemed to fly by? It's hard to believe that 2017 is almost here. This offers a great chance to reflect on the concept that time, and life, moves very quickly. This means that important things, including working towards financial goals, can get past us almost before we know it. In my work as an author for Seeking Alpha, I just finished an article especially for you. Here is how I summarize its intent: Certainly, your 20s is a time to have fun, explore life, and enjoy a wide variety of enjoyable experiences. It is not my goal to change that. At the same time, you can take small, meaningful steps to ensure your financial future, and you are wise to do so. In the article, I outline a step-by-step plan that you can take, right now, to make 2017 the year that you begin to invest in your future. Have a look . ----------- Authors Note: If you like my work, I would be profoundly grateful if you would take a minute to follow me on Twitter , Fa

Born In The USA - Best Domestic Stock ETFs For Your Portfolio

I got to thinking about Bruce Springsteen's iconic song Born in the U.S.A .  Why? Because, for most U.S. investors, the first ETF you should add to your portfolio should be a top-quality U.S. total stock market ETF . Really, this forms the foundation for any well-diversified portfolio. There are several worthy competitors in the marketplace. And, they may be even more worthy if your brokerage offers commission-free trading in these ETFs; particularly if one of your goals is to invest regularly and in small increments. In this recent article I wrote for Seeking Alpha , I briefly review 5 such ETFs, pick 3 winners and 2 runner-ups, and briefly reference a 6th just for good measure. I hope you enjoy.

Positano - And A Key Benefit Of ETF Investing

Image
Readers who are aware of either my Twitter account or blog may have noticed, and hopefully enjoyed, the beautiful picture of Positano featured in the header. This amazing Italian town is basically cut into the side of a hill. To get anywhere, you have to be willing to either walk up and down stairs, or find some form of conveyance to get around the narrow road that winds its way through the town (and still almost certainly walk up and down a few stairs to your final destination). It was from one of the higher vantage points in the town that the beautiful picture I feature was taken. The beautiful dome or 'Duomo' you see belongs to the Collegiate Church of Santa Maria Assunta , originally the abbey of Positano's 10th-century Benedictine monastery, and restored in the 18th century. In the background shimmer the waters of the Tyrrhenian Sea, a part of the Mediterranean Sea off the western coast of Italy. It was no accident that this author, who writes almost exclusi

Index - 'ETF Monkey Focus' Series

Welcome to the index for the ETF Monkey Focus series of articles I have written for Seeking Alpha. First, here is a link to the introductory article for the series. In this article, I present helpful information concerning both the basic structure, as well as helpful common features, that I plan to put in each article. Here, in alphabetical article by symbol, are all ETFs on which I have at least commented to-date. Check back often, as new ETFs will be added as they are covered.

Introducing the 'ETF Monkey Focus' Series For Seeking Alpha

The inaugural article  of my new 'ETF Monkey Focus' series for Seeking Alpha was published today. As my readers are well aware, I believe that low expenses and diversification are two solid "anchors" of a well-constructed portfolio. Ultimately, I hope to report on over 100 ETFs that meet those criteria. Each article will feature one specific sector, and likely compare somewhere between 2 -5 ETFs. This first article begins with an introduction to the series and outlines both the structure as well as helpful common features that each article will contain. Next, it kicks off the series by comparing 5 U.S. Total Market ETFs. I am excited about this new series, and hope the information shared will be extremely beneficial. Feel free to drop your comments and suggestions either below this article, or on the Seeking Alpha site. ----------- Authors Note: If you like my work, I would be profoundly grateful if you would take a minute to follow me on Twitter , Face

Apple Trump'd

Image
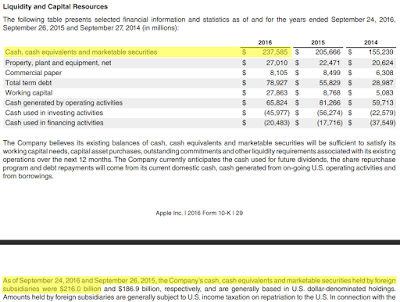
For today, just three quick pictures. First, from Apple's latest 10-K. As shown above, as of the most recent quarterly report, Apple's cash hoard is a whopping $237 billion. But notice the highlighted phrase in the bottom paragraph. Of that amount, some $216 billion is held offshore, outside the borders of the U.S. The trouble is, to bring that cash back home, Apple would have to pay the U.S. corporate tax rate of 35% on those funds. I'll do the math for you. That's $75.6 billion. To this point, Apple has politely turned down that "offer," preferring to use low-interest-rate debt to return cash to shareholders in the form of dividends and buybacks. As of yesterday, enter Donald J. Trump. Take a look at this, from the tax plan announced on his campaign website.

3 Keys To Creating A Winning Investment Portfolio

Image
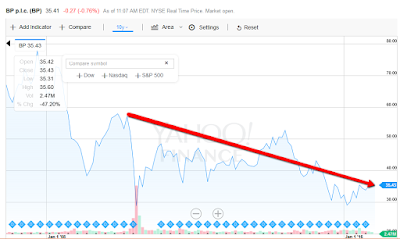
When building your investment portfolio, you can choose from many different methods. One is to chase the latest hot stocks. In this method, you search frantically for "hot tips," whether from an investment analyst on CNBC or your coworker, who's "been in stocks for years" and "really knows what he is doing." Unfortunately, if through this method you chose British Petroleum back in 2010, here's how your results would have looked. I am going to suggest that there is a better way.

Solid Anchors For Your Portfolio

I just finished an educational series of articles for Seeking Alpha on the topic of solid anchors for your portfolio. I opened one of the articles with this introductory paragraph: Just as literal anchors are used to save sailing vessels from shipwreck, certain key concepts or "anchors" can go a long way towards saving your investment portfolio from metaphorical shipwreck. Since, in this modern 21st century, many of us depend on our investments to help carry us through our retirement, this becomes a matter of some importance. In the three articles, I discuss the anchors of low expenses , diversification , and dividends . In each case, I explain the importance of the selected anchor, offer an explanation of how to achieve it, and then show real-world examples of the application of each anchor in various ETF Monkey model portfolios. This is a wonderful series of articles for both the younger or beginning investor, as well as an individual who may be of modest means and y

T & VZ: Another Example Of Rebalancing Theory At Work

Regular readers know that AT&T and Verizon represent two of the four individual-stock positions in my portfolio. Combined, my target weighting for these two stocks is 5% of my portfolio. These are significant income-generators for me. With dividend yields just a hair under 5% at today's prices, these two stocks contribute almost 10% of my total dividends in the portfolio. Today, I own 5 shares more of each stock that I did at the beginning of the year. And those shares were virtually free, thanks to my process of disciplined rebalancing. Let me explain. As of June 21, 2016, following sharp increases in price, AT&T & Verizon held weightings of 2.87% and 2.84%, respectively, in my portfolio. Combined, that represented a 5.71% weighting, or some 14.2% (in relative terms) over my target weight. So, in disciplined fashion, I sold enough of each to bring their weightings back to approximately 2.50%. Here are the transactions:

ADDENDUM: The ETF Monkey 2016 Model Portfolio Q3 Update

On October 5, I published the Q3 update for The ETF Monkey 2016 Model Portfolio on Seeking Alpha. In that article I noted that, of the 3 implementations I set up, the Charles Schwab implementation was the winner through Q3. This morning, in the process of doing research for another article I hope to write on the value of dividends in your ETF-based portfolio, I happened to note that the Charles Schwab implementation had brought in substantially less dividends through Q3 than either the Vanguard or Fidelity implementations. When I dug in to understand the reasons why, I quickly discovered that the following three Schwab ETFs pay dividends annually as opposed to quarterly: Schwab International Equity ETF ( SCHF ) Schwab Emerging Markets Equity ETF ( SCHE ) Schwab U.S. TIPS ETF ( SCHP ) While, in theory, this does not imply additional outperformance by the Schwab implementation of the portfolio (since the share price should be reduced by the value of the dividends), it does mea

Jamba Juice Exits the JambaGO Platform

My regular readers may recognize the fact that Jamba Juice ( JMBA ) is the one tiny, speculative position in my personal portfolio. When new CEO David Pace took the reins a few months back, it quickly became apparent that the new management team, and likely the company's large investors, felt that previous CEO James White had devoted too much time and expense to developing peripheral lines of business, and not enough to developing the core business. As a result, I was not surprised to see the company recently announce that they are exiting the JambaGO business . Essentially, this operation dispensed pre-made smoothies from a machine, similar to the way you might buy a Slurpee at 7-Eleven. I would not be surprised to find that the new management team felt that this initiative likely diluted their "premium" brand. Speculative investors might look to pick up a few shares. This new team just might be on the right track.

Apple's Much-Maligned iPhone SE Strikes Back

Image
Just a quick hit for today. Apple has taken a lot of flack for its recently introduced iPhone SE. Given that, I found this quote from Tim Cook on today's earnings call very interesting. We had a very successful global launch of iPhone SE, and demand outstripped supply throughout the quarter . We brought on additional capacity and were able to achieve supply/demand balance as we entered the September quarter. At its launch, we said that the addition of the iPhone SE to the iPhone lineup placed us in a better position to meet the needs of customers who love a four-inch phone and to attract even more customers into our ecosystem. In both cases, that strategy is working. Our initial sales data tells us that the iPhone SE is popular in both developed and emerging markets , and the percentage of iPhone SE sales going to customers who are new to iPhone is greater than we've seen in the first weeks of availability for other iPhones launched in the last several years.

Quick Take: Vanguard Core + REIT vs. Vanguard Core - 7/25/16

Image
I recently published the Q2 update for The ETF Monkey Vanguard Core Portfolio. As my readers may recall, I set up a variant of this portfolio that I called The ETF Monkey Vanguard Core + REIT Portfolio . This idea was based on my personal portfolio, in which I maintain a dedicated allocation to REITs. For those interested, the above-linked article explains the rationale for this, as well as features the fact that I set up this particular variant by removing a rather arbitrary 2.5% weighting from each of the asset classes in the "base" portfolio such that I ended up with an initial weighting of 7.5% for REITs. A commenter on one of my recent Seeking Alpha articles suggested that REITs are a useful addition to a diversified portfolio. It was this comment that led me to develop this quick update on my own variant of such a portfolio. Here, then, as of the market close on July 25, 2016, is the cumulative performance of The ETF Monkey Vanguard Core + REIT Portfolio: F

Has Starbucks Lost Its Way?

Image
I couldn't help but notice that same-store-sales in the quarterly results announced today fell short of expectations. For me, this did not come as a total shock. ETF Monkey has loved Starbucks for years. In the course of my work travels, I frequented their locations in Seattle back in the days when they were small. They were amazing. The quality of everything they served was top-notch. I wanted to meet their HR person, because my experience was that virtually every employee went above and beyond your expectations. It was like they had enjoyed a little too much of their own product, but in a good way. Cheery, bubbly, upbeat. And then they got big. Very big.

The ETF Monkey Vanguard Core Portfolio: 2016 Q2 Update

Image
Author's Note: If you find my work valuable, I would deeply appreciate your taking a minute to follow me on Twitter , Google + , and/or Facebook and/or sharing a link to this article on your social media accounts. This article is an update to the following articles: On July 1, 2015, I wrote an article for Seeking Alpha introducing  The ETF Monkey Vanguard Core Portfolio . On January 4, 2016, I wrote the 2015 year-end update for the portfolio. On April 5, 2016, I followed that up with the 2016 Q1 update . On April 13, 2016, I executed a second rebalancing transaction for the year. In this article, I will report on the performance of the portfolio for the period ended July 18, 2016. I was on vacation on June 30 and unable to capture the required screen shots to document an update as of that date. While this Q2 update is a little late, as it turns out the sharp rebound following the Brexit announcement offers a nice opportunity to evaluate the performance of the portfolio

My Favorite Hotel In Washington DC

I thought I would take a quick break from my normal postings for something a little different. I enjoy traveling. And in particular, I enjoy some of the great cities. I have never been a "lay around on the beach" kind of guy. Anyway, my wife and I discovered a little hotel in Washington DC a year or so ago that we really love. I wanted to share it with you. It's The Normandy Hotel. Here's a link to their website , which describes the hotel as "A charming urban oasis in Washington DC." I second that description. It is located just a few blocks north of the Dupont Circle metro station. It is a bit of a hike up the hill but, hey, who doesn't need the exercise? If you find the walk a little too daunting, not to worry. Bus lines also run up the hill and will drop you within a block or so of the hotel. The hotel is in the Kalorama area of DC. If that sounds at all familiar, perhaps it is because you recently read that President Obama plans to lease a h

A Quick Example Of Rebalancing Theory At Work

Image
I know I go on and on about disciplined rebalancing. In this article , I also address the concept that each asset class in your portfolio can be viewed as a form of "currency," and can be expensive or cheap. Today, I merely wanted to share a quick real-world example of how this worked in my personal portfolio. The picture below is a 6-month graph from Yahoo Finance. The blue line represents the Vanguard REIT ETF (VNQ), the red line the Vanguard Utilities ETF (VPU) and the green line the S&P 500 average. You will quickly notice that both VNQ and, even more dramatically, VPU have outperformed the S&P. As a result, the "overweight" indicator recently flashed up for both of them in my portfolio, to the tune of about 7-8% overweight. The red arrows represent my two recent sales to bring them back in line; VNQ on 5/9 and VPU on 5/13. Want to know a little secret? As I write this, both are now slightly underweight in my portfolio. The sharp drop you see in

The Crucial Role Of Emotion In Investing

Just a quick post for today. A few days ago, I wrote an article for this blog entitled Millennials: Here's Your Best 2016 Investment Portfolio . Long story short, my friends over at Seeking Alpha apparently liked the article enough that they reproduced it on their site . I received several comments on the article; some extremely favorable and even a little emotional for me. Others, not so much. Here's an example: You say this "plan" is for people in their mid 20's early 30's. Bull. Anyone that age should have a high appetite for risk, and therefore growth, which is only achieved by picking individual stocks. Keep your paltry gains. Anyways, that's investing on easy mode. No fun, and meager returns. I wish you would have included this in your article. Well, at least the commenter had an unequivocal opinion. I like that.

6 ETFs For A Winning Millennial Investment Portfolio

Image
Congratulations! Here you are. A successful millennial. For the sake of argument, we are going to put you in the middle of this group, generally described as being born roughly between 1980 and 2000. We'll stipulate that you are born in 1990, so graduated college in 2012 and are now four years into your working career. At 26 years of age, you have a long and bright working future ahead of you. You are clever enough to know that you should start investing now. At the same time, you are not all about money. You don't want to be a slave to your investments, you want your investments to be a slave to you, and give you both the time and freedom to devote to the things that are important to you. I'll cut right to the chase. There are a ton of investment strategies from which you can choose. Here is the one I would suggest. First, open a brokerage account at Fidelity Investments. Second, buy these six ETFs, in the weightings shown: 45% - iShares Core S&P Total U

The ETF Monkey Vanguard Core Portfolio: April 13, 2016 Rebalance

Image
Back on February 11, 2016, I executed a series of transactions to rebalance The ETF Monkey Vanguard Core Portfolio . As explained in that article, the severe decline in both domestic and foreign stocks left these two asset classes significantly underweight, with bonds being overweight. Here, for convenience, is a "before and after" snapshot of that transaction. As it turns out, the timing of that rebalancing could not have been better. In hindsight, it can be seen that February 11 represented, at least to this point, the low point for 2016. I don't take particular credit for this. My efforts were simply an application of the principles found in this article .

The ETF Monkey Vanguard Core Portfolio: 2016 Q1 Update

Image
This article is an update to the following articles: On July 1, 2015, I wrote an article for Seeking Alpha introducing  The ETF Monkey Vanguard Core Portfolio . On January 4, 2016, I wrote the 2015 year-end update for the portfolio.  On February 11, 2016, following the severe market decline during the first part of 2016, I wrote a  follow-up  article that detailed a rebalancing  transaction that I executed to bring the portfolio back in line with my target weightings. In this article, I will report on the performance of the portfolio for the quarter ended March 31, 2016. Evaluating the Portfolio: Q1 2016 Here is the corresponding Google Finance page for the portfolio as of the market's close on 3/31/16. Have a look, and then I will offer a few comments. First, as a reference point, the S&P 500 index closed at 2,043.94 on December 31, 2015 and 2,059.74 on March 31, 2016, for a gain of .77% for the period. 

ETF Snapshot: MGC

Image
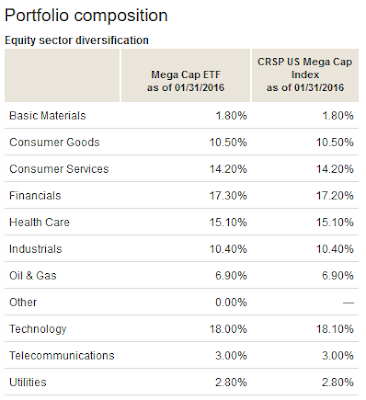
ETF Name:  Vanguard Mega Cap ETF Asset Class:  Domestic Stock - Large Blend Index Tracked:  CRSP US Mega Cap Index Expense Ratio:  .09% Assets Under Management:  $1.1 billion Number of Holdings:  293 Price/Earnings Ratio:  19.2 Price/Book Ratio:  2.7 SEC Yield:  2.26%

Trading Wal-Mart For A Couple of Solid ETFs

Image
In a recent article , I featured the concept of being alert to various forms of "currency" when structuring and rebalancing your portfolio. I would like to share with you a quick example of how I did just that in my own portfolio this morning. Last October, I added Wal-Mart ( WMT ) to my personal portfolio. I wrote about the decision in this article for Seeking Alpha. As it turns out, this proved to be a timely purchase. While the markets in general have been extremely volatile to open 2016, WMT has risen a solid 10% from my average purchase price of ~$60.00. However, several recent articles from Seeking Alpha authors whom I respect have questioned WMT's valuation at these prices. Here is one example of such an article. I decided that I agreed with their view.

ETF Snapshot: SCHO

Image
ETF Name:  Schwab Short-Term U.S. Treasury ETF Asset Class:  Short Government Bond Index Tracked:  Barclays U.S. Treasury 1-3 Yr TR USD Expense Ratio:  .08% Assets Under Management:  $1.2 billion Number of Holdings:  68 Average Duration:  1.86 Years SEC Yield:  .36%

ETF Snapshot: SCHF

Image
ETF Name:  Schwab International Equity ETF Asset Class:  Foreign Large Blend Index Tracked:  FTSE Developed ex-US Index Expense Ratio:  .08% Assets Under Management:  $4.7 billion Number of Holdings:  1,216 Price/Earnings Ratio:  15.06 Price/Book Ratio:  1.62 SEC Yield:  2.37%

ETF Snapshot: SPY

Image
ETF Name:  SPDR S&P 500 ETF Asset Class:  Domestic Stock - Large Cap Index Tracked:  S&P 500 Index Expense Ratio:  .0945% Assets Under Management:  $169.62 billion Number of Holdings:  504 Price/Earnings Ratio:  17.32 Price/Book Ratio:  2.44 SEC Yield:  2.22%

ETF Snapshot: SCHA

Image
ETF Name:  Schwab U.S. Small-Cap ETF Asset Class:  Domestic Stock - Small Blend Index Tracked:  Dow Jones U.S. Small Cap Total Stock Market Index Expense Ratio:  .08% Assets Under Management:  $2.6 billion Number of Holdings:  1,757 Price/Earnings Ratio:  19.17 Price/Book Ratio:  1.93 SEC Yield:  1.96%

ETF Snapshot: BNDS

Image
ETF Name:  SPDR Barclays Aggregate Bond ETF Asset Class:  Intermediate-Term Bond Index Tracked:  Barclays U.S. Aggregate Bond Index Expense Ratio:  .08% Assets Under Management:  $30.6 billion Number of Holdings:  2,682 Average Duration:  5.40 Years Yield to Maturity:  2.27%

ETF Snapshot: AGG

Image
ETF Name:  iShares Core U.S. Aggregate Bond ETF Asset Class:  Intermediate-Term Bond Index Tracked:  Barclays US Aggregate Bond Index Expense Ratio:  .08% Assets Under Management:  $30.6 billion Number of Holdings:  4,983 Average Duration:  5.12 Years Yield to Maturity:  2.45%

Rebalancing The ETF Monkey Vanguard Core Portfolio

Image
In connection with the philosophy explained in this article , I executed a series of rebalancing transactions in The ETF Monkey Vanguard Core Portfolio as of pricing available at approximately 9:30 a.m. Pacific Time on February 11, 2016. The Rebalancing Transactions Here is a graphic of the Excel worksheet I used to analyze the rationale for rebalancing, calculate and track the necessary transactions, as well as display the "before and after" status of the portfolio. Please note that you can click on the picture to see an enlarged view. Rebalancing The ETF Monkey Vanguard Core Portfolio - Before and After As can be seen in the "Before Rebalancing" section, due to the extremely sharp decline in both domestic and foreign stocks during this first part of 2016, the weightings of these asset classes had fallen significantly below our targets; almost 2% in the case of foreign stocks. At the same time, bonds were 1.3% above their target weight , and we also had

Are You A Trader Or An Investor? - And Finding Your Comfortable Risk Level

Image
The year 2016 has opened with great volatility in the markets. This, combined with the constant (and often conflicting) headlines and sound bites that bombard us through the media can cause an investor to become fearful, lose their nerve. and even panic. This leads to ill-conceived trading ; buying and selling simply to do something . Here's how Warren Buffett put it on one occasion: Those people who can sit quietly for decades when they own a farm or apartment house too often become frenetic when they are exposed to a stream of stock quotations and accompanying commentators delivering an implied message of “Don’t just sit there,  do  something.” For these investors, liquidity is transformed from the unqualified benefit it should be to a curse.  In contrast, if one is an investor , some measure of volatility inevitably comes with this. The key is to find your own comfort level with volatility and risk, and then behave in a disciplined manner. For a quick graphic representatio

ETF Snapshot: SCHM

Image
ETF Name:  Schwab U.S. Mid-Cap ETF Asset Class:  Domestic Stock - Mid Cap Blend Index Tracked:  Dow Jones U.S. Mid Cap Total Stock Market Index Expense Ratio:  .07% Assets Under Management:  $1.81 billion Number of Holdings:  507 Price/Earnings Ratio:  19.18 Price/Book Ratio:  2.24 SEC Yield:  1.90%

ETF Snapshot: SCHH

Image
ETF Name:  Schwab U.S. REIT ETF Asset Class:  Real Estate Index Tracked:  Dow Jones U.S. Select REIT Index Expense Ratio:  .07% Assets Under Management:  $1.77 billion Number of Holdings:  97 Price/Earnings Ratio:  37.60 Price/Book Ratio:  2.47 Distribution Yield:  2.58%

Thoughts On Portfolio Rebalancing and "Currency"

Image
Author's Note: If you find my work valuable, I would deeply appreciate your taking a minute to follow me on Twitter , Google + , and/or Facebook and/or sharing a link to this article on your social media accounts. Back in November, 2015, I wrote a fairly comprehensive article for Seeking Alpha on the subject of portfolio rebalancing . I was honored with the piece being selected as an Editor's Pick. In this brief piece, I want to touch on a somewhat related question. What is "currency"? In general, when someone says "currency," likely the first thing that comes to mind is "cash." After all, cash is the legal tender of the country in which we live. With cash, we can buy assets. However, don't forget the perspective that the assets in our portfolio are also a form of currency. To see what I mean, take a quick look at the two screenshots I share below. The first picture features my personal asset allocation as of December 31, 2015. ET

Words Of The Sage: Warren Buffett On Investing

Image
For this series, "Words of the Sage," it is my goal to share selected investment thoughts and advice from some of the foremost investors of our times. I couldn't think of a better person to start with than Warren Buffett. Warren Buffett - A Brief Biography Warren Buffett was born on August 30, 1930, in Omaha, Nebraska. Readers may recognize that time frame as falling in the midst of the Great Depression . Nebraska did not escape the effects of this difficult period, and Buffett early on learned the value of the dollar. While still a boy, Buffett sold soft drinks and had a paper route. As one example of his early financial prowess, at the tender age of 15 he managed to amass $2,000 and use it to buy a 40-acre farm, the income from which helped him to pay his way through university. Following his graduation from university, Buffett worked with his idol and mentor, Benjamin Graham, even moving to live in New York for a time. However, in 1956 he returned to Omah

ETF Snapshot: SCHP

Image
ETF Name:  Schwab U.S. TIPS ETF Asset Class:  Inflation-Protected Bond Index Tracked:  Barclays U.S. Treasury Inflation Protected Securities (TIPS) Index (Series-L) Expense Ratio:  .07% Assets Under Management:  $862.6 million Number of Holdings:  37 Average Duration:  7.68 Years SEC Yield:  1.79%

ETF Snapshot: IUSG

Image
ETF Name:  iShares Core U.S. Growth ETF Asset Class:  Domestic Stock Index Tracked:  Russell 3000 Growth Index Expense Ratio:  .07% Assets Under Management:  $891.4 million Number of Holdings:  1,834 Price/Earnings Ratio:  21.00 Price/Book Ratio:  5.18 SEC Yield:  1.42%

ETF Snapshot: IUSV

Image
ETF Name:  iShares Core U.S. Value ETF Asset Class:  Domestic Stock Index Tracked:  Russell 3000 Value Index Expense Ratio:  .07% Assets Under Management:  $687.8 million Number of Holdings:  2,035 Price/Earnings Ratio:  13.67 Price/Book Ratio:  1.53 SEC Yield:  2.49%

Thoughts On Investing, Steve Jobs, And You

Image
"Save and invest." This is advice we commonly hear from our earliest years; either from our parents, a teacher, professor, mentor, or adviser. And with those words, we are introduced to the subject of investing . Later, you may hear about the market . As in, "The market was up (or down) today!" Finally, sooner or later you will likely hear someone either bragging about, or bemoaning the state of, their portfolio . But what, exactly, is investing ? What is the market ? What is a portfolio ? What does it all mean? There are many highly technical definitions of investing  to which I could point you. In fact, I just did, via the link in the last sentence. Here, though, is a very simple one to ponder: When you commit a dollar today with the expectation of receiving more than a dollar tomorrow. I hope that simple sentence captures the basic essence of investing. If you have no expectation of that dollar being worth more tomorrow, you might as well spend it toda

ETF Snapshot: IVV

Image
ETF Name:  iShares Core S&P 500 ETF Asset Class:  Domestic Stock - Large Blend Index Tracked:  S&P 500 Index Expense Ratio:  .07% Assets Under Management:  $63.5 billion Number of Holdings:  504 Price/Earnings Ratio:  17.11 Price/Book Ratio:  2.50 SEC Yield:  2.05%

ETF Snapshot: SCHV

Image
ETF Name:  Schwab U.S. Large-Cap Value ETF Asset Class:  Domestic Stock - Large Value Index Tracked:  Dow Jones U.S. Large Cap Value Total Stock Market Index Expense Ratio:  .06% Assets Under Management:  $1.65 billion Number of Holdings:  355 Price/Earnings Ratio:  17.40 Price/Book Ratio:  2.10 SEC Yield:  3.12%

ETF Snapshot: SCHG

Image
ETF Name:  Schwab U.S. Large-Cap Growth ETF Asset Class:  Domestic Stock - Large Growth Index Tracked:  Dow Jones U.S. Large Cap Growth Total Stock Market Index Expense Ratio:  .06% Assets Under Management:  $2.4 billion Number of Holdings:  430 Price/Earnings Ratio:  21.38 Price/Book Ratio:  3.78 SEC Yield:  1.09%

ETF Snapshot: VOO

Image
ETF Name:  Vanguard S&P 500 ETF Asset Class:  Domestic Stock - Large Blend Index Tracked:  S&P 500 Index Expense Ratio:  .05% Assets Under Management:  $40.4 billion Number of Holdings:  503 Price/Earnings Ratio:  20.5 Price/Book Ratio:  2.8 SEC Yield:  2.12%

ETF Snapshot: SCHX

Image
ETF Name:  Schwab U.S. Large-Cap ETF Asset Class:  Domestic Stock - Large Blend Index Tracked:  Dow Jones U.S. Large-Cap Total Stock Market Index Expense Ratio:  .03% Assets Under Management:  $4.8 billion Number of Holdings:  763 Price/Earnings Ratio:  19.11 Price/Book Ratio:  2.69 SEC Yield:  2.11%

ETF Snapshot: SCHZ

Image
ETF Name:  Schwab U.S. Aggregate Bond ETF Asset Class:  Intermediate-Term Bond Index Tracked:  Barclays U.S. Aggregate Bond Index Expense Ratio:  .05% Assets Under Management:  $2.1 billion Number of Holdings:  2,640 Average Duration:  5.3 Years Yield to Maturity:  2.70%

ETF Snapshot: SCHB

Image
ETF Name:  Schwab U.S. Broad Market ETF Asset Class:  Domestic Stock - General Index Tracked:  Dow Jones U.S. Broad Stock Market Index Expense Ratio:  .03% Assets Under Management:  $5.3 billion Number of Holdings:  2,082 Price/Earnings Ratio:  19.08 Price/Book Ratio:  2.58 SEC Yield:  2.10%

ETF Snapshot: ITOT

Image
ETF Name:  iShares Core S&P Total U.S. Stock Market ETF Asset Class:  Domestic Stock - General Index Tracked:  S&P Total Market Index (TMI) Expense Ratio:  .03% Assets Under Management:  $2.8 billion Number of Holdings:  3,786 Price/Earnings Ratio:  17.78 Price/Book Ratio:  2.48 SEC Yield:  2.02%

ETF Snapshot: BND

Image
ETF Name:  Vanguard Total Bond Market ETF Asset Class:  Intermediate-Term Bond Index Tracked:  Barclays U.S. Aggregate Float Adjusted Bond Index Expense Ratio:  .07% Assets Under Management:  $27.2 billion Number of Holdings:  7,746 Average Duration:  5.8 Years Yield to Maturity:  2.4%

ETF Snapshot: VTI

Image
ETF Name:  Vanguard Total Stock Market ETF Asset Class: Domestic Stock - General Index Tracked: CRSP US Total Market Index Expense Ratio: .05% Assets Under Management: $58.1 billion Number of Holdings: 3,791 Price/Earnings Ratio: 22.5 Price/Book Ratio: 2.7 SEC Yield: 2.00%

The ETF Monkey Vanguard Core Portfolio: 2015 Year-End Update

Image
This article is an update to the following articles: On July 1, 2015, I wrote an article for Seeking Alpha introducing The ETF Monkey Vanguard Core Portfolio . On August 26, 2015, following the severe market decline culminating on August 24, I wrote a follow-up article both evaluating the performance of the portfolio as well as executing a rebalancing transaction to bring the portfolio back in line with my target weightings. In this article, I will report on the performance of the portfolio between August 24 and the end of the year on December 31. I have decided to move this and future updates for this portfolio to my personal blog so that Seeking Alpha readers do not get confused between this portfolio and The ETF Monkey 2016 Model Portfolio I introduced at the end of the year. As a convenience to readers of this article, here is a graphic of how the portfolio stood on 8/24/15 after my rebalancing transaction ( Note: You can click on any picture to see an enlarged versi