This article is an update to the following articles:
- On July 1, 2015, I wrote an article for Seeking Alpha introducing The ETF Monkey Vanguard Core Portfolio.
- On August 26, 2015, following the severe market decline culminating on August 24, I wrote a follow-up article both evaluating the performance of the portfolio as well as executing a rebalancing transaction to bring the portfolio back in line with my target weightings.
In this article, I will report on the performance of the portfolio between August 24 and the end of the year on December 31. I have decided to move this and future updates for this portfolio to my personal blog so that Seeking Alpha readers do not get confused between this portfolio and
The ETF Monkey 2016 Model Portfolio I introduced at the end of the year.
As a convenience to readers of this article, here is a graphic of how the portfolio stood on 8/24/15 after my rebalancing transaction (Note: You can click on any picture to see an enlarged version).
Evaluating the Portfolio: August 24 Through December 31, 2015
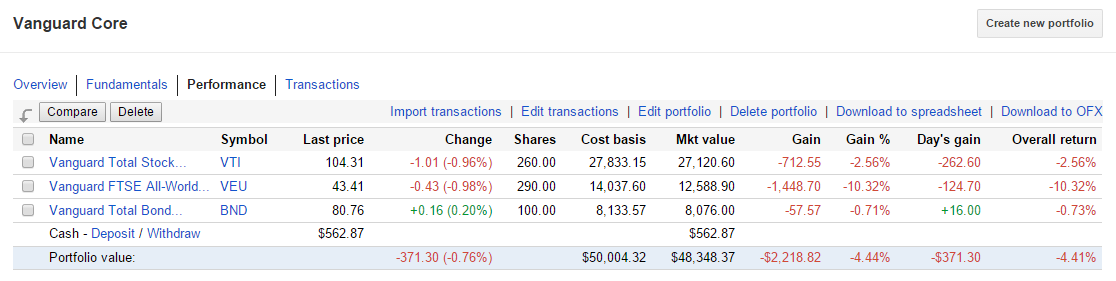
Here is the corresponding Google Finance page for the portfolio as of the market's close on 12/31/15. Have a look, and then I will offer a few comments.
First, as a reference point, the S&P 500 index closed at 1,893.21 on August 24 and 2,043.94 on December 31, for a gain of 7.96% for the period.
Second, the portfolio received dividends totaling $536.84 during this period, bringing the cash balance in the portfolio from $26.03 to $562.87. This came from the 3 ETFs as follows:
- VTI - $283.66
- VEU - $163.27
- BND - $89.91
So how did the portfolio perform? If you compare the two graphics, you will find the closing value of the portfolio to be $46,142.53 on August 24 and $48,348.37 on December 31, for a gain of 4.78%. Therefore, the portfolio underperformed the S&P 500 by 3.18% over this period.
Let's break down the performance, and reasons, by asset class.
- Domestic Stocks - During the period, VTI grew from $25,511.20 to $27,120.60, an increase of $1,609.40. Add in the $283.66 of dividends and VTI gained $1,893.06 on a base of $25,511.20, a gain of 7.42%. As can be seen, this is a slight underperformance when compared to the S&P 500 index. This can be attributed to the fact that VTI embraces the complete U.S. market, including small and micro-cap stocks. As it turns out, this group was very weak during the period. As a reference point, the Russell 2000 Index closed at 1,135.89 on December 31 vs. 1,111.69 on August 24, a mere 2.18% increase. This drag caused the overall U.S. market to underperform the S&P 500, which is comprised of large-cap stocks.
- Foreign Stocks - During the period, VEU grew from $12,403.30 to $12,588.90, an increase of $185.60. Add in the $163.27 of dividends and VTI gained $348.87 on a base of $12,403.30, a gain of 2.81%. As compared to the U.S. market, this reflects the continued underperformance of foreign markets, particularly emerging markets, As a reference point, the Nikkei 225 Index closed at 19,033.71 on December 31 vs. 18,540.68 on August 24, a mere 2.65% increase.
- Bonds - During the period, BND actually declined slightly from $8,202.00 to $8,076.00, a decrease of $126.00. This was offset somewhat by the $89.91 of dividends, leaving BND with an overall decrease of $36.09 on a base of $8,202.00, a loss of .44%. This reflected a slight softening of bond prices as the market looked to digest the Fed's December interest rate hike, and all the uncertainties that came with it.
No Transactions or Rebalancing This Period
Here's how the portfolio stood in terms of its asset allocations at 12/31/15.
Since I am (deliberately) incurring commission expense on all transactions for this portfolio, in an attempt to make it as "real world" as possible, it is my decision at this time not to execute any transactions, either to purchase anything with the available cash or move any amounts between asset classes. No asset class has a variance of even 1% from its target weight.
Summary and Conclusion
The good news is that the portfolio has managed to recover somewhat from August 24. On that date, the portfolio had decreased by 7.79% from its opening $50,000 balance as of June 30, 2015. Still, this was not a great period for the portfolio. Slight weakness in small-cap U.S. stocks, continued turmoil in the international markets and a softening bond market combined for, well, a soft performance for the portfolio, still leaving us with an overall 4.44% decrease as we end the year. I am looking forward to see if we can turn this into a positive number in 2016.
At the same time, this simple, diversified, low-cost portfolio did manage to turn in a positive performance for the period, as well as throwing off $536.84 in dividends which I will be able to put to use at such time as I discern a solid reason to do so.
-----------
Disclosure: I am not a registered investment advisor or broker/dealer. Readers are cautioned that the material contained herein should be used solely for informational purposes, and are encouraged to consult with their financial and/or tax advisor respecting the applicability of this information to their personal circumstances. Investing involves risk, including the loss of principal. Readers are solely responsible for their own investment decisions.


Comments
Post a Comment