This article is designed for individuals who are Fidelity Brokerage clients, as I am, and who have an interest in building a low-cost, diversified ETF portfolio.
Here are just a couple of very valid scenarios for considering this subject:
- You have a 401(k) account from a former employer which you have just left sitting there because you don't quite know what to do with the funds. Likely, you are paying annual fees of 1-2% on those investments. You may be able to roll those funds into a Fidelity IRA and create a core ETF portfolio with an overall expense ratio of perhaps one-tenth that amount, with the difference going straight into your pocket.
- You already have, or wish to establish, a non-retirement investment account at Fidelity. You wish to invest in modest monthly increments while ensuring that your investments are well-diversified.
NOTE: If you are new to ETFs, you can learn a little more about them
here.
However, since ETFs trade just like stocks, trading commissions can eat into your profits each time you either rebalance your portfolio or desire to make small incremental investments, as proposed in scenario #2. How can you best approach this challenge?
As it happens, Fidelity has a very nice offering for you;
commission-free trading in 70 ETFs from the iShares family from
BlackRock, Inc. (NOTE: As of this writing, the only caveat is that Fidelity charges a short-term trading fee of $7.95 for
any sales that occur within 30 days of the original purchase of the ETF,with the oldest shares in the account being depleted first.)
Finding The Best ETFs For Your Core Portfolio
But which ETFs should you choose? You may be pleasantly surprised to find that you can put together a comprehensive, well-diversified, portfolio with as few as 3 or 4 ETFs. So let's apply some of the tools Fidelity provides and find the best ETFs with which to start your core portfolio.
I started by using Fidelity's screening tool to filter the number of ETFs up for consideration. Have a look at the picture below and then I will offer some comments:
 |
| Click to Enlarge |
- I started by filtering for ETFs with an expense ratio of .15% or less. In today's competitive environment, with wonderful competing offerings from firms such as Vanguard Funds and Charles Schwab, there is no reason to accept a higher expense ratio for core funds.
- I next looked for ETFs with Assets Under Management (AUM) of $1 billion or more. This helps to ensure both liquidity as well as a tight trading spread (the difference between what sellers will accept and buyers are willing to pay).
- Finally, I looked for ETFs that had been in existence for at least two years, in other words with a track record which can be evaluated.
From these filters, a list of 14 ETFs emerged:
 |
| Click to Enlarge |
We are going to focus on three of these ETFs to build our core portfolio. I will explain each asset class as well as the ETF I selected and why. I will conclude with some comments on alternate options you may wish to consider, as well as how to develop a proper weighting in each.
Domestic Stocks: iShares Core S&P 500 ETF (IVV)
Our first asset class is
domestic stocks. These are stocks of companies that are based in the U.S. and traded on U.S. stock exchanges. It is worth noting that many of these are multinationals, meaning that they also have foreign operations. So, you get a measure of globalization even from this asset class.
In my view, you could go one of two ways in this asset class and do well, either selecting the
iShares Core S&P Total U.S. Stock Market ETF (
ITOT)
or my ultimate selection.
Both funds carry an extremely low .07% expense ratio. In terms of diversification, I actually have a preference for ITOT. ITOT tracks an index that combines the S&P 500, 400, and 600 indexes, or a total of approximately 1,500 holdings. The theoretical benefit is that the broader index includes smaller companies which may offer the potential for greater long-term growth.
Why, then, have I ultimately selected IVV for our portfolio? Basically, it comes down to two things: 1) The advantages of the fund's size, and 2) Recent performance. Let's first compare some data concerning fund size from the BlackRock fact sheets for
IVV and
ITOT.
- First of all, the AUM for IVV is a whopping $70.3 billion vs. $2.5 billion for ITOT.
- This translates into an 20-day average share volume of 833,362 for IVV vs. 21,134 for ITOT.
- This, in turn, translates to a tighter premium/discount factor of .06% for IVV vs. .08% for ITOT.
Let's turn next to a couple of performance-related items. Any way you measure it, IVV has a higher dividend distribution than ITOT. For
12-month Trailing Yield, it is 2.04% to 1.79% in favor of IVV. For
Distribution Yield, the numbers are 2.24% vs. 1.70%. Finally
30 Day SEC Yield is 1.96% vs. 1.88%, again in favor of IVV.
Lastly, here is a look at comparative share price performance over the past two years, courtesy of Yahoo Finance (IVV is the blue line, ITOT the red line):
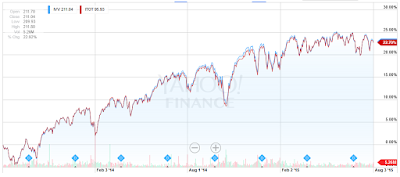 |
| IVV vs. ITOT - Two Year Chart (Click to Enlarge) |
You can't see the final result of the blue line as it is hidden behind the red, but you can probably tell it is slightly higher. In fact, the value is 23.32% for IVV vs. the 22.70% shown for ITOT.
In summary, the evidence points to the fact that, not only has IVV offered a greater distribution %, it has slightly outperformed ITOT over the past two years. All of this makes it the winner in this asset class.
Foreign Stocks: iShares Core MSCI Total International Stock ETF (IXUS)
It is my view that every investor should include at least some weighting in foreign stocks in their portfolio. Principally, this is because they offer the benefits of
diversification as well as potentially greater
growth. In
this article, I provide more detail for those who are interested.
In this section, I am also going to pick a winner but offer you an alternate approach as well.
I selected IXUS to keep it simple. Oftentimes, there is great beauty in simplicity, and therefore I don't discount it. The key beauty in IXUS is that it gives you great global diversity, including both developed and emerging markets, in one ETF. If you are interested in exploring the difference between the two, you can find more information
here.
Here is some information from the BlackRock fact sheet for
IXUS.
- The fund tracks the MSCI All Country World Ex-USA Investable Markets Index. It contains some 3,364 holdings across 21 countries, offering great diversification in one fund.
- It has a low .14% expense ratio. While slightly higher than top domestic stock ETFs, such as IVV and ITOT, this expense ratio is extremely good considering the added expenses involved in trading foreign stocks.
- With approximately $1.7 billion in AUM and almost 32,000 shares trading across a 20-day average, the fund is highly liquid.
An Alternate Approach
You will see the first ETF, IEFA, on the filtered list I provide above. However, you will not see IEMG on the list. Not to worry, the only reason is because its .18% expense ratio did not make the cut on my rather arbitrary filter. However, you might also note that IEFA carries a .12% expense ratio, lower than IXUS.
So what is going on? In contrast to IXUS, which pretty much covers the entire world outside the U.S. in a single ETF, IEFA tracks purely the developed markets and IEMG tracks purely the emerging markets.
In other words, if this is attractive to you, you can actively control your exposure to emerging markets. If you desire no exposure at all, simply substitute IEFA for IXUS. Alternatively, you can introduce IEMG to give you whatever exposure you desire to emerging markets. Looking at it the other way, you could use a combination of IEFA and IEMG to gain greater exposure to emerging markets than you get in IXUS. Your weighted expense ratio, clearly, will be the result of whatever portion you allocate to IEFA at .12% vs. IEMG at .18%.
Bonds: iShares Core U.S. Aggregate Bond ETF (AGG)
In this asset class, AGG is the clear choice. Before we go any further,
this article that I previously wrote for Seeking Alpha explains why every investor should hold at least some representation in bonds in their core portfolio, even during periods where interest rates are expected to rise.
From my list, the only other candidate I considered was the
iShares iBoxx $ Investment Grade Corporate Bond ETF (LQD).
Here are the data points from the BlackRock fact sheets for
AGG and
LQD that easily tipped me in favor of AGG:
- AGG's .08% expense ratio easily beats LQD's .15%. All other things being equal, I am always going to favor the candidate with the lower expense ratio, as this comes out of your returns in both good times and bad. (NOTE: This includes a 1-year fee waiver of .01% through June 30, 2016. However, since there are several competing offerings from other ETF providers, I believe BlackRock will stay very competitive with respect to expenses.)
- AGG is more diversified, including both government and corporate bonds, as opposed to just corporate bonds in LQD.
- AGG's average duration is 5.29 years vs. 8.11 years for LQD. Put simply, this implies that, should overall interest rates rise by 1%, AGG's principal value would be expected to decline by approximately 5.29% whereas LQD would be expected to decline by 8.11%. While LQD offers a higher current dividend yield (SEC 30 Day Yield of 3.55% vs 2.04%), that risk to your principal must be considered.
Overall Portfolio Weighting & Allocation
So there you have it, our three core ETFs;
IVV,
IXUS, and
AGG. But how should you allocate your portfolio?
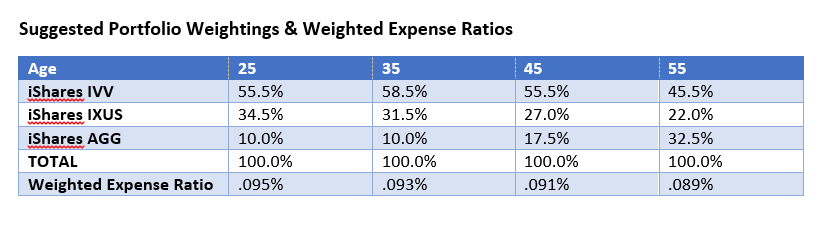
Please see the following table for some suggested allocations, by age, along with the weighted expense ratio for each portfolio:
 |
| Click to Enlarge |
How, though, did I arrive at these suggested allocations? To answer that question, I am going to refer you to another article I wrote for Seeking Alpha. In this article, I
designed a very similar portfolio, but using Vanguard ETFs. The asset allocation shown in the table above is based on this research, but using iShares ETFs.
If you decide to use my alternate method for the foreign portion of the portfolio, simply multiply the suggested foreign weighting by the desired percentage of developed vs. emerging markets. (
Example: If you are in the '45' age group, you will see from the above table that your overall desired foreign weighting is 27%. If you would like 20% of that to be in emerging markets, then you would select a 21.6% weighting (27% * .8) in IEFA and a 5.4% weighting (27% * .2) in IEMG.)
Finally, the
Weighted Expense Ratio was derived by multiplying the
percentage allocation in each ETF by the
expense ratio for that ETF, and then summing the values. If you examine the table closely, you will see the relationship. The allocations which contain a higher percentage of IXUS, with its .14% expense ratio, have a slightly higher weighted expense ratio. In all cases, though, you will notice that our overall ratio is less than .10%, or one-tenth of one percent.
Summary and Conclusion
In summary, we have built a core ETF portfolio designed specifically for Fidelity Brokerage clients. We have used three iShares ETFs (or four if you select the alternative option for foreign stocks) for which Fidelity offers commission-free trading. Additionally, we have built a high-quality, diversified portfolio with an overall expense ratio of less than .10%.
I hope this article has proved helpful and, as always, happy investing!
-----------
Disclosure: I am not a registered investment advisor or broker/dealer. Readers are cautioned that the material contained herein should be used solely for informational purposes, and are encouraged to consult with their financial and/or tax advisor respecting the applicability of this information to their personal circumstances. Investing involves risk, including the loss of principal. Readers are solely responsible for their own investment decisions.


I needed to create you the very small word in order to thank you yet again for those incredible advice you've shared at this time. It's simply unbelievably generous with people like you to deliver extensively exactly what some people might have marketed for an e book to help with making some dough for their own end, and in particular considering the fact that you might well have done it in case you desired. Those advice in addition worked to become great way to comprehend many people have the same passion similar to my very own to know the truth much more when it comes to this condition. I am sure there are millions of more fun moments up front for many who discover your site. China Aktien
ReplyDeleteMy developer is trying to persuade me to move to .net from PHP. I have always disliked the idea because of the expenses. But he's tryiong none the less. I've been using WordPress on various websites for about a year and am nervous about switching to another platform. I have heard good things about blogengine.net. Is there a way I can import all my wordpress posts into it? Any help would be really appreciated! China Aktien
ReplyDelete