Posts

Showing posts from February, 2016

Featured Post

Clearly, Not Everyone Is Getting Rich Off The Stock Market

Image
Well, the NY Fed was out today with its Quarterly Report on Household Debt and Credit for Q4 2017. Clearly, Americans are in a lot of debt. Take a look. Just a couple of quick hits from the report. Total U.S. household debt rose $193 billion in the 4th quarter, to a new all-time peak of $13.15 trillion. That's 17.9% above the most recent trough in Q2 2013. Broken down by segment, what do you suppose was the largest gain in percentage terms? Credit cards, with a 3.2% increase. In the picture above, the widening gap represented by the red arrows reflects the fact that non-housing debt is rising at a faster pace than housing debt. Here's what's troubling about that. Below is a picture of the stock market, as represented by the S&P 500 index, over that same period; from the most recent credit trough in Q2 2013 to the end of 2017. And thus, the title of this article. Over that period, the S&P 500 index rose by 75%; from roughly 1,600 to 2,800. Apparently, ho...
ETF Snapshot: MGC

Image
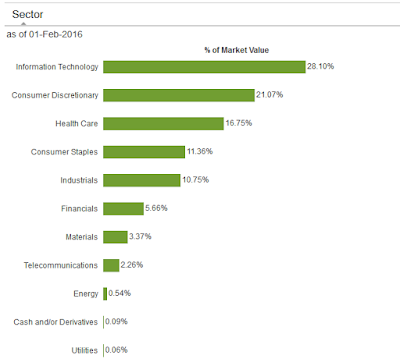
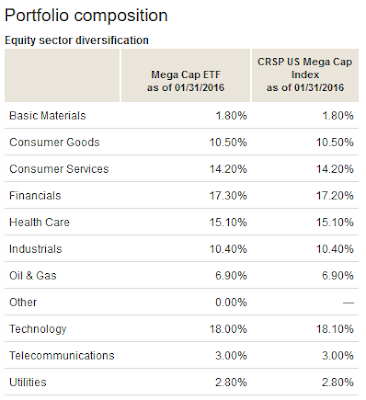
ETF Name:  Vanguard Mega Cap ETF Asset Class:  Domestic Stock - Large Blend Index Tracked:  CRSP US Mega Cap Index Expense Ratio:  .09% Assets Under Management:  $1.1 billion Number of Holdings:  293 Price/Earnings Ratio:  19.2 Price/Book Ratio:  2.7 SEC Yield:  2.26%

Trading Wal-Mart For A Couple of Solid ETFs

Image
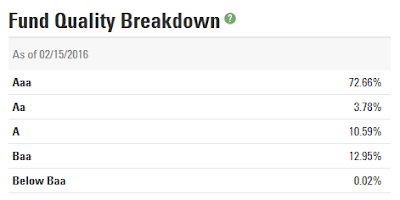
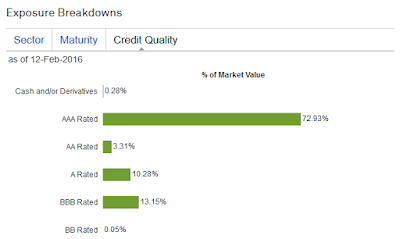
In a recent article , I featured the concept of being alert to various forms of "currency" when structuring and rebalancing your portfolio. I would like to share with you a quick example of how I did just that in my own portfolio this morning. Last October, I added Wal-Mart ( WMT ) to my personal portfolio. I wrote about the decision in this article for Seeking Alpha. As it turns out, this proved to be a timely purchase. While the markets in general have been extremely volatile to open 2016, WMT has risen a solid 10% from my average purchase price of ~$60.00. However, several recent articles from Seeking Alpha authors whom I respect have questioned WMT's valuation at these prices. Here is one example of such an article. I decided that I agreed with their view.

ETF Snapshot: SCHO

Image
ETF Name:  Schwab Short-Term U.S. Treasury ETF Asset Class:  Short Government Bond Index Tracked:  Barclays U.S. Treasury 1-3 Yr TR USD Expense Ratio:  .08% Assets Under Management:  $1.2 billion Number of Holdings:  68 Average Duration:  1.86 Years SEC Yield:  .36%

ETF Snapshot: SCHF

Image
ETF Name:  Schwab International Equity ETF Asset Class:  Foreign Large Blend Index Tracked:  FTSE Developed ex-US Index Expense Ratio:  .08% Assets Under Management:  $4.7 billion Number of Holdings:  1,216 Price/Earnings Ratio:  15.06 Price/Book Ratio:  1.62 SEC Yield:  2.37%

ETF Snapshot: SPY

Image
ETF Name:  SPDR S&P 500 ETF Asset Class:  Domestic Stock - Large Cap Index Tracked:  S&P 500 Index Expense Ratio:  .0945% Assets Under Management:  $169.62 billion Number of Holdings:  504 Price/Earnings Ratio:  17.32 Price/Book Ratio:  2.44 SEC Yield:  2.22%

ETF Snapshot: SCHA

Image
ETF Name:  Schwab U.S. Small-Cap ETF Asset Class:  Domestic Stock - Small Blend Index Tracked:  Dow Jones U.S. Small Cap Total Stock Market Index Expense Ratio:  .08% Assets Under Management:  $2.6 billion Number of Holdings:  1,757 Price/Earnings Ratio:  19.17 Price/Book Ratio:  1.93 SEC Yield:  1.96%

ETF Snapshot: BNDS

Image
ETF Name:  SPDR Barclays Aggregate Bond ETF Asset Class:  Intermediate-Term Bond Index Tracked:  Barclays U.S. Aggregate Bond Index Expense Ratio:  .08% Assets Under Management:  $30.6 billion Number of Holdings:  2,682 Average Duration:  5.40 Years Yield to Maturity:  2.27%

ETF Snapshot: AGG

Image
ETF Name:  iShares Core U.S. Aggregate Bond ETF Asset Class:  Intermediate-Term Bond Index Tracked:  Barclays US Aggregate Bond Index Expense Ratio:  .08% Assets Under Management:  $30.6 billion Number of Holdings:  4,983 Average Duration:  5.12 Years Yield to Maturity:  2.45%

Rebalancing The ETF Monkey Vanguard Core Portfolio

Image
In connection with the philosophy explained in this article , I executed a series of rebalancing transactions in The ETF Monkey Vanguard Core Portfolio as of pricing available at approximately 9:30 a.m. Pacific Time on February 11, 2016. The Rebalancing Transactions Here is a graphic of the Excel worksheet I used to analyze the rationale for rebalancing, calculate and track the necessary transactions, as well as display the "before and after" status of the portfolio. Please note that you can click on the picture to see an enlarged view. Rebalancing The ETF Monkey Vanguard Core Portfolio - Before and After As can be seen in the "Before Rebalancing" section, due to the extremely sharp decline in both domestic and foreign stocks during this first part of 2016, the weightings of these asset classes had fallen significantly below our targets; almost 2% in the case of foreign stocks. At the same time, bonds were 1.3% above their target weight , and we also had ...

Are You A Trader Or An Investor? - And Finding Your Comfortable Risk Level

Image
The year 2016 has opened with great volatility in the markets. This, combined with the constant (and often conflicting) headlines and sound bites that bombard us through the media can cause an investor to become fearful, lose their nerve. and even panic. This leads to ill-conceived trading ; buying and selling simply to do something . Here's how Warren Buffett put it on one occasion: Those people who can sit quietly for decades when they own a farm or apartment house too often become frenetic when they are exposed to a stream of stock quotations and accompanying commentators delivering an implied message of “Don’t just sit there,  do  something.” For these investors, liquidity is transformed from the unqualified benefit it should be to a curse.  In contrast, if one is an investor , some measure of volatility inevitably comes with this. The key is to find your own comfort level with volatility and risk, and then behave in a disciplined manner. For a quick graphic rep...

ETF Snapshot: SCHM

Image
ETF Name:  Schwab U.S. Mid-Cap ETF Asset Class:  Domestic Stock - Mid Cap Blend Index Tracked:  Dow Jones U.S. Mid Cap Total Stock Market Index Expense Ratio:  .07% Assets Under Management:  $1.81 billion Number of Holdings:  507 Price/Earnings Ratio:  19.18 Price/Book Ratio:  2.24 SEC Yield:  1.90%

ETF Snapshot: SCHH

Image
ETF Name:  Schwab U.S. REIT ETF Asset Class:  Real Estate Index Tracked:  Dow Jones U.S. Select REIT Index Expense Ratio:  .07% Assets Under Management:  $1.77 billion Number of Holdings:  97 Price/Earnings Ratio:  37.60 Price/Book Ratio:  2.47 Distribution Yield:  2.58%

Thoughts On Portfolio Rebalancing and "Currency"

Image
Author's Note: If you find my work valuable, I would deeply appreciate your taking a minute to follow me on Twitter , Google + , and/or Facebook and/or sharing a link to this article on your social media accounts. Back in November, 2015, I wrote a fairly comprehensive article for Seeking Alpha on the subject of portfolio rebalancing . I was honored with the piece being selected as an Editor's Pick. In this brief piece, I want to touch on a somewhat related question. What is "currency"? In general, when someone says "currency," likely the first thing that comes to mind is "cash." After all, cash is the legal tender of the country in which we live. With cash, we can buy assets. However, don't forget the perspective that the assets in our portfolio are also a form of currency. To see what I mean, take a quick look at the two screenshots I share below. The first picture features my personal asset allocation as of December 31, 2015. ET...

Words Of The Sage: Warren Buffett On Investing

Image
For this series, "Words of the Sage," it is my goal to share selected investment thoughts and advice from some of the foremost investors of our times. I couldn't think of a better person to start with than Warren Buffett. Warren Buffett - A Brief Biography Warren Buffett was born on August 30, 1930, in Omaha, Nebraska. Readers may recognize that time frame as falling in the midst of the Great Depression . Nebraska did not escape the effects of this difficult period, and Buffett early on learned the value of the dollar. While still a boy, Buffett sold soft drinks and had a paper route. As one example of his early financial prowess, at the tender age of 15 he managed to amass $2,000 and use it to buy a 40-acre farm, the income from which helped him to pay his way through university. Following his graduation from university, Buffett worked with his idol and mentor, Benjamin Graham, even moving to live in New York for a time. However, in 1956 he returned to Omah...

ETF Snapshot: SCHP

Image
ETF Name:  Schwab U.S. TIPS ETF Asset Class:  Inflation-Protected Bond Index Tracked:  Barclays U.S. Treasury Inflation Protected Securities (TIPS) Index (Series-L) Expense Ratio:  .07% Assets Under Management:  $862.6 million Number of Holdings:  37 Average Duration:  7.68 Years SEC Yield:  1.79%

ETF Snapshot: IUSG

Image
ETF Name:  iShares Core U.S. Growth ETF Asset Class:  Domestic Stock Index Tracked:  Russell 3000 Growth Index Expense Ratio:  .07% Assets Under Management:  $891.4 million Number of Holdings:  1,834 Price/Earnings Ratio:  21.00 Price/Book Ratio:  5.18 SEC Yield:  1.42%