In an
article dated 7/22/15, I introduced the
ETF Monkey Vanguard Core + REIT Portfolio. As outlined in that article, this is a variant of the
ETF Monkey Vanguard Core Portfolio that I developed as a
writer for Seeking Alpha. Following the various links provided, readers can trace the building blocks used to construct both portfolios as little or as much as desired.
In each variant, the basic premise was that an investor can build a highly-diversified, low-cost, portfolio using a small number of ETFs. In the case of this portfolio, four ETFs are used. As outlined in the original article, this portfolio was "purchased" at the 6/30/15 closing prices. As a reference point, we will use the S&P 500 index, which closed at 2,063.12 on 6/30/15.
Q3 Update
The 3rd quarter of 2015 was a rough one for the markets. The S&P 500 index closed at 1,920.03 on 9/30/15, down some 6.94% from 6/30/15. With that in mind, take a look at the picture below (you can click to enlarge it) and then I will share a few comments.
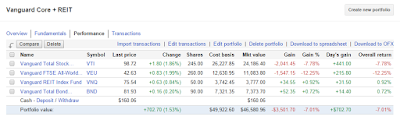 |
| Closing Prices and Balances as of 9/30/15 |
As can be seen, the portfolio virtually equaled the S&P 500, dropping 7.01% as opposed to 6.94% for the index. A closer look reveals that the foreign component, as represented by the
Vanguard FTSE All-World ex-US ETF, suffered a drop of 12.25%. One large reason for this performance was China, where the Shanghai Composite Index dropped a breathtaking 28.61% during the quarter (closing price of 4,277.22 on 6/30/15 vs. 3,053.32 on 9/30/15). Given the fact that the portfolio started the quarter with a 24.50% weighting in foreign stocks, the overall performance was not too bad.
Clearly, the portfolio's allocation of bonds and REITs provided some stability during a very difficult quarter. Interestingly, bonds have generally been viewed in a negative light of late due to the "inevitable" rise in interest rates. As it turned out, slowing economies put a damper on a widely expected September interest rate increase from the Fed, and bonds did well.
Additionally, REITs experienced negative returns in Q2. As it happens, the closing price of VNQ on 6/30/15, and the price at which we bought the portfolio's initial position, was the low point of Q2 and rebounded nicely in Q3. This, also, was partly due to low interest rates and possibly REITs being viewed as a "safe haven" during the market turmoil of September, in particular.
Perhaps the key takeaway from all this is the benefit of holding a diversified portfolio. During Q3, the steep decline in foreign equities was to some extent cushioned by two asset classes that were quite out of favor as of the end of Q2.
With respect to dividends, and our ending cash balance, the fund took in the following dividends during Q3:
- NOTE: Two additional dividends, from VTI and VNQ, were actually declared in Q3 but not paid until October 1. Those will be reflected in the Q4 update.
Rebalancing Analysis
A key to good portfolio maintenance is periodic rebalancing, moving funds from asset classes that have outperformed and into those which have underperformed. I tend to believe in active rebalancing as opposed to simply based on calendar dates. In other words, if a particular asset class experiences a sharp increase while another simultaneously experiences a steep decline, I leave myself open to rebalancing the portfolio in real time, not simply following a "rebalance every 6 months" strategy or similar.
Have a look at where our portfolio stands as of 9/30, and then I will offer some comments.
 |
| Evaluating the Need for Rebalancing |
As you look at the spreadsheet, doubtless it makes intuitive sense to you. Domestic and foreign stocks, which performed badly during the quarter, are now slightly underweight, whereas bonds and REITs are overweight.
However, to make our hypothetical portfolio as "real world" as possible, I am deliberately incurring Fidelity's normal trading commissions on all trades. As I look at the portfolio, I do not feel that any asset classes are out of balance by a significant enough percentage or dollar amount to execute a trade. Nor have I yet accumulated enough in dividends to make a cost-effective purchase. So, for now, my decision is to stand pat.
I look forward to updating you again at the end of Q4.
Happy investing!
-----------
Disclosure: I am not a registered investment advisor or broker/dealer. Readers are cautioned that the material contained herein should be used solely for informational purposes, and are encouraged to consult with their financial and/or tax advisor respecting the applicability of this information to their personal circumstances. Investing involves risk, including the loss of principal. Readers are solely responsible for their own investment decisions.


Comments
Post a Comment