Posts

Featured Post

Clearly, Not Everyone Is Getting Rich Off The Stock Market

Image
Well, the NY Fed was out today with its Quarterly Report on Household Debt and Credit for Q4 2017. Clearly, Americans are in a lot of debt. Take a look. Just a couple of quick hits from the report. Total U.S. household debt rose $193 billion in the 4th quarter, to a new all-time peak of $13.15 trillion. That's 17.9% above the most recent trough in Q2 2013. Broken down by segment, what do you suppose was the largest gain in percentage terms? Credit cards, with a 3.2% increase. In the picture above, the widening gap represented by the red arrows reflects the fact that non-housing debt is rising at a faster pace than housing debt. Here's what's troubling about that. Below is a picture of the stock market, as represented by the S&P 500 index, over that same period; from the most recent credit trough in Q2 2013 to the end of 2017. And thus, the title of this article. Over that period, the S&P 500 index rose by 75%; from roughly 1,600 to 2,800. Apparently, ho...

The ETF Monkey Vanguard Core Portfolio: April 13, 2016 Rebalance

Image
Back on February 11, 2016, I executed a series of transactions to rebalance The ETF Monkey Vanguard Core Portfolio . As explained in that article, the severe decline in both domestic and foreign stocks left these two asset classes significantly underweight, with bonds being overweight. Here, for convenience, is a "before and after" snapshot of that transaction. As it turns out, the timing of that rebalancing could not have been better. In hindsight, it can be seen that February 11 represented, at least to this point, the low point for 2016. I don't take particular credit for this. My efforts were simply an application of the principles found in this article .

The ETF Monkey Vanguard Core Portfolio: 2016 Q1 Update

Image
This article is an update to the following articles: On July 1, 2015, I wrote an article for Seeking Alpha introducing  The ETF Monkey Vanguard Core Portfolio . On January 4, 2016, I wrote the 2015 year-end update for the portfolio.  On February 11, 2016, following the severe market decline during the first part of 2016, I wrote a  follow-up  article that detailed a rebalancing  transaction that I executed to bring the portfolio back in line with my target weightings. In this article, I will report on the performance of the portfolio for the quarter ended March 31, 2016. Evaluating the Portfolio: Q1 2016 Here is the corresponding Google Finance page for the portfolio as of the market's close on 3/31/16. Have a look, and then I will offer a few comments. First, as a reference point, the S&P 500 index closed at 2,043.94 on December 31, 2015 and 2,059.74 on March 31, 2016, for a gain of .77% for the period. 

ETF Snapshot: MGC

Image
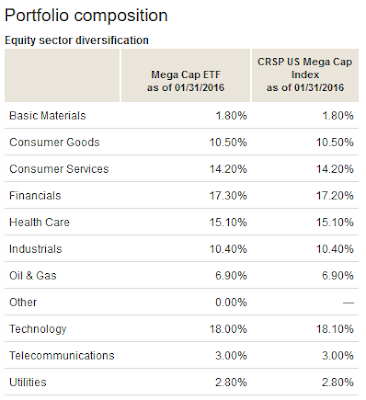
ETF Name:  Vanguard Mega Cap ETF Asset Class:  Domestic Stock - Large Blend Index Tracked:  CRSP US Mega Cap Index Expense Ratio:  .09% Assets Under Management:  $1.1 billion Number of Holdings:  293 Price/Earnings Ratio:  19.2 Price/Book Ratio:  2.7 SEC Yield:  2.26%

Trading Wal-Mart For A Couple of Solid ETFs

Image
In a recent article , I featured the concept of being alert to various forms of "currency" when structuring and rebalancing your portfolio. I would like to share with you a quick example of how I did just that in my own portfolio this morning. Last October, I added Wal-Mart ( WMT ) to my personal portfolio. I wrote about the decision in this article for Seeking Alpha. As it turns out, this proved to be a timely purchase. While the markets in general have been extremely volatile to open 2016, WMT has risen a solid 10% from my average purchase price of ~$60.00. However, several recent articles from Seeking Alpha authors whom I respect have questioned WMT's valuation at these prices. Here is one example of such an article. I decided that I agreed with their view.

ETF Snapshot: SCHO

Image
ETF Name:  Schwab Short-Term U.S. Treasury ETF Asset Class:  Short Government Bond Index Tracked:  Barclays U.S. Treasury 1-3 Yr TR USD Expense Ratio:  .08% Assets Under Management:  $1.2 billion Number of Holdings:  68 Average Duration:  1.86 Years SEC Yield:  .36%

ETF Snapshot: SCHF

Image
ETF Name:  Schwab International Equity ETF Asset Class:  Foreign Large Blend Index Tracked:  FTSE Developed ex-US Index Expense Ratio:  .08% Assets Under Management:  $4.7 billion Number of Holdings:  1,216 Price/Earnings Ratio:  15.06 Price/Book Ratio:  1.62 SEC Yield:  2.37%

ETF Snapshot: SPY

Image
ETF Name:  SPDR S&P 500 ETF Asset Class:  Domestic Stock - Large Cap Index Tracked:  S&P 500 Index Expense Ratio:  .0945% Assets Under Management:  $169.62 billion Number of Holdings:  504 Price/Earnings Ratio:  17.32 Price/Book Ratio:  2.44 SEC Yield:  2.22%