Posts

Featured Post

Clearly, Not Everyone Is Getting Rich Off The Stock Market

Image
Well, the NY Fed was out today with its Quarterly Report on Household Debt and Credit for Q4 2017. Clearly, Americans are in a lot of debt. Take a look. Just a couple of quick hits from the report. Total U.S. household debt rose $193 billion in the 4th quarter, to a new all-time peak of $13.15 trillion. That's 17.9% above the most recent trough in Q2 2013. Broken down by segment, what do you suppose was the largest gain in percentage terms? Credit cards, with a 3.2% increase. In the picture above, the widening gap represented by the red arrows reflects the fact that non-housing debt is rising at a faster pace than housing debt. Here's what's troubling about that. Below is a picture of the stock market, as represented by the S&P 500 index, over that same period; from the most recent credit trough in Q2 2013 to the end of 2017. And thus, the title of this article. Over that period, the S&P 500 index rose by 75%; from roughly 1,600 to 2,800. Apparently, ho...

Last Week Was Rough - But Here's Some Perspective in Four Pictures

Image
Last week was a rough week for the stock market. After declines beginning Tuesday of the previous week, on Monday 8/24/15 the Dow Jones average took a frightening nosedive at the open, initially falling over 1,000 points before closing down a "mere" 588.40 points. Of course, this generated lots of headlines. The markets continued to rise and fall in wild, breathtaking motion through Wednesday of the week before mounting a sustained 2-day rally by Friday's close. Using the broader S&P 500 Index as a gauge, here's a visual look at the week, extending slightly back into the previous week to make the decline appear even more dramatic (please note that you can click on any of the pictures to enlarge): Now, that red line looks pretty horrible, doesn't it? This, of course, led to lots of panicked calls to financial advisors from clients fretting about the state of their portfolios, as well as newscasters conducting breathless on-air interviews on the eveni...

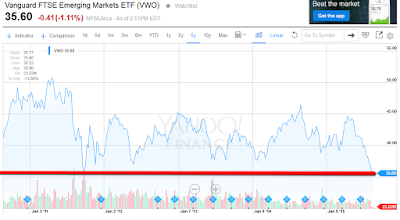
Action Alert: Consider VWO

Image
Today's action alert features the Vanguard FTSE Emerging Markets ETF (VWO). This ETF, as the name implies, focuses on emerging markets. Take a quick look at the picture below and the I will offer some brief comments.

Best iShares ETFs - A Core Portfolio For Fidelity Brokerage Clients

Image
This article is designed for individuals who are Fidelity Brokerage clients, as I am, and who have an interest in building a low-cost, diversified ETF portfolio. Here are just a couple of very valid scenarios for considering this subject: You have a 401(k) account from a former employer which you have just left sitting there because you don't quite know what to do with the funds. Likely, you are paying annual fees of 1-2% on those investments. You may be able to roll those funds into a Fidelity IRA and create a core ETF portfolio with an overall expense ratio of perhaps one-tenth that amount, with the difference going straight into your pocket. You already have, or wish to establish, a non-retirement investment account at Fidelity. You wish to invest in modest monthly increments while ensuring that your investments are well-diversified. NOTE: If you are new to ETFs, you can learn a little more about them here . However, since ETFs trade just like stocks, trading commissi...

Presenting: The ETF Monkey Vanguard Core + REIT Portfolio

Image
I recently wrote a series of articles for the Seeking Alpha website, for which I have the privilege of being a certified author . The initial articles covered, in detail, three ETFs from the Vanguard family which can be used very nicely to build a simple, yet incredibly well-diversified portfolio. These are the Vanguard Total Stock Market ETF , the Vanguard Total Bond Market ETF , and the Vanguard FTSE All-World ex-US ETF .  Ultimately, those articles culminated in a final article in which I presented The ETF Monkey Vanguard Core Portfolio . In that article, I developed several suggested weightings for each of the three components, based on an investor's age and risk tolerance. I accomplished this by working from the guidance available by reviewing the portfolio composition and weighting of various professionally-managed  Vanguard Target Date funds. Finally, I selected one and built a hypothetical $50,000 portfolio, the performance of which I will track going forward...

3 ETFs To Anchor Your Domestic Portfolio

NOTE:  This article was written for exclusive publication on  Seeking Alpha . Per their guidelines, I am reproducing the first 250 words or less here, followed by a link to the source article for those interested in reading further. Every investor desirous of developing an ETF-based portfolio does well to start by selecting a few core holdings. In my view, such holdings should offer great diversification along with a rock-bottom cost structure. In a  previous article  for Seeking Alpha, I featured the  Vanguard Total Stock Market ETF  (NYSEARCA: VTI ). I concluded that one should seriously consider VTI as a core holding for the portion of your portfolio devoted to domestic stocks. However, there are several worthy competitors in the marketplace.  . . .

Major ETF Families: BlackRock, Inc. (iShares ETFs)

Image
BlackRock, Inc. is the largest provider of ETFs, with over $809 billion in Assets Under Management (AUM) as of June 30, 2015 . BlackRock's ETFs are marketed under the name iShares . BlackRock was founded in 1988 by Laurence D. (Larry) Fink, Robert S. Kapito, Susan Wagner, Barbara Novick, Ben Golub, Hugh Frater, Ralph Schlosstein and Keith Anderson. Previously, Fink, Kapito, Golub and Novick had all worked for First Boston. Fink and his partners had been pioneers in the field of mortgage-backed securities. Initially, Fink and his partners received funding from Pete Peterson of The Blackstone Group. Their goal was to build a disciplined asset management firm, with an emphasis on risk management. In 1992, the firm adopted the name BlackRock. Ultimately, BlackRock became a public company in 1999, with broad employee ownership.

Action Alert: Consider VIG

Image
Today's action alert features the Vanguard Dividend Appreciation ETF . Have a quick look at the chart below. It reveals that, since March 2, 2015, this ETF has fallen 4.24% against only 1.32% on the S&P 500 index. Click to Enlarge