Posts

Showing posts from August, 2015

Featured Post

Clearly, Not Everyone Is Getting Rich Off The Stock Market

Image
Well, the NY Fed was out today with its Quarterly Report on Household Debt and Credit for Q4 2017. Clearly, Americans are in a lot of debt. Take a look. Just a couple of quick hits from the report. Total U.S. household debt rose $193 billion in the 4th quarter, to a new all-time peak of $13.15 trillion. That's 17.9% above the most recent trough in Q2 2013. Broken down by segment, what do you suppose was the largest gain in percentage terms? Credit cards, with a 3.2% increase. In the picture above, the widening gap represented by the red arrows reflects the fact that non-housing debt is rising at a faster pace than housing debt. Here's what's troubling about that. Below is a picture of the stock market, as represented by the S&P 500 index, over that same period; from the most recent credit trough in Q2 2013 to the end of 2017. And thus, the title of this article. Over that period, the S&P 500 index rose by 75%; from roughly 1,600 to 2,800. Apparently, ho...

Last Week Was Rough - But Here's Some Perspective in Four Pictures

Image
Last week was a rough week for the stock market. After declines beginning Tuesday of the previous week, on Monday 8/24/15 the Dow Jones average took a frightening nosedive at the open, initially falling over 1,000 points before closing down a "mere" 588.40 points. Of course, this generated lots of headlines. The markets continued to rise and fall in wild, breathtaking motion through Wednesday of the week before mounting a sustained 2-day rally by Friday's close. Using the broader S&P 500 Index as a gauge, here's a visual look at the week, extending slightly back into the previous week to make the decline appear even more dramatic (please note that you can click on any of the pictures to enlarge): Now, that red line looks pretty horrible, doesn't it? This, of course, led to lots of panicked calls to financial advisors from clients fretting about the state of their portfolios, as well as newscasters conducting breathless on-air interviews on the eveni...

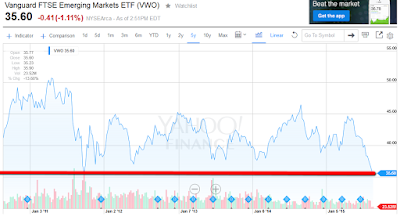
Action Alert: Consider VWO

Image
Today's action alert features the Vanguard FTSE Emerging Markets ETF (VWO). This ETF, as the name implies, focuses on emerging markets. Take a quick look at the picture below and the I will offer some brief comments.

Best iShares ETFs - A Core Portfolio For Fidelity Brokerage Clients

Image
This article is designed for individuals who are Fidelity Brokerage clients, as I am, and who have an interest in building a low-cost, diversified ETF portfolio. Here are just a couple of very valid scenarios for considering this subject: You have a 401(k) account from a former employer which you have just left sitting there because you don't quite know what to do with the funds. Likely, you are paying annual fees of 1-2% on those investments. You may be able to roll those funds into a Fidelity IRA and create a core ETF portfolio with an overall expense ratio of perhaps one-tenth that amount, with the difference going straight into your pocket. You already have, or wish to establish, a non-retirement investment account at Fidelity. You wish to invest in modest monthly increments while ensuring that your investments are well-diversified. NOTE: If you are new to ETFs, you can learn a little more about them here . However, since ETFs trade just like stocks, trading commissi...